Market Overview
Since the last newsletter, the technology sector has been the main driver of selling pressure. On a year-to-date basis the S&P 500 is down 5.1%, the DJII -2.3% and the NASDAQ Composite is down 10.3%.
During March, financial markets experienced notable volatility:
The NASDAQ Composite declined 11.3% (steepest monthly drop since 2022), the S&P 500 dropped 7.2% and the Dow Jones Industrial Average fell 4.25%. Heightened policy-related trade tensions, a resurgence in inflation and consumer sentiment were the drivers:
- One of the catalysts has been President Trump’s imposition of 25% tariffs on goods from Mexico, Canada, China, and all foreign-made automobiles, and further protectionist steps expected to take place in early April. These tariffs, aimed at addressing perceived trade imbalances and (over the longer term) bolstering domestic manufacturing, have raised concerns about retaliatory actions from key trading partners, higher costs for businesses and consumers and potential supply chain disruptions.
- Inflation data released in March indicated that the core personal consumption expenditures (PCE) index rose by 2.8% year-over-year in February, with a monthly increase of 0.4%, the highest in a year. This unexpected rise in inflation, combined with Trump's tariff plans, raised concerns about rising prices and potential stagflation.
- Consumer sentiment fell for the third straight month.
All of the above led the major indices to face significant pullbacks. While unsettling, it's important to remember that corrections are a normal part of investing. Markets move in cycles, and periods of volatility often present opportunities for long-term investors. Despite the recent downturn, our year-to-date returns remain slightly ahead of the S&P 500, driven by our broader diversification strategy.
Now is an appropriate time to revisit your personal risk tolerance. If the market movement made you uncomfortable, it may be a sign that your portfolio is not aligned with your true risk tolerance level.
- Aggressive investors expect and can withstand higher volatility and in general have a longer time horizon;
- Moderate investors seek a balance between risk and reward;
- Conservative investors prioritize capital preservation over growth.
Consider rebalancing to ensure you’re invested at a level that allows you to stay the course confidently and maintain a long-term perspective rather than reacting to short-term fluctuations. History has shown that disciplined investors who stick to their strategy, rather than react emotionally to short-term movements, tend to see stronger long-term results. Stay patient, stay invested, and stay aligned with your financial goals.
What We’re Watching
Index of Consumer Sentiment
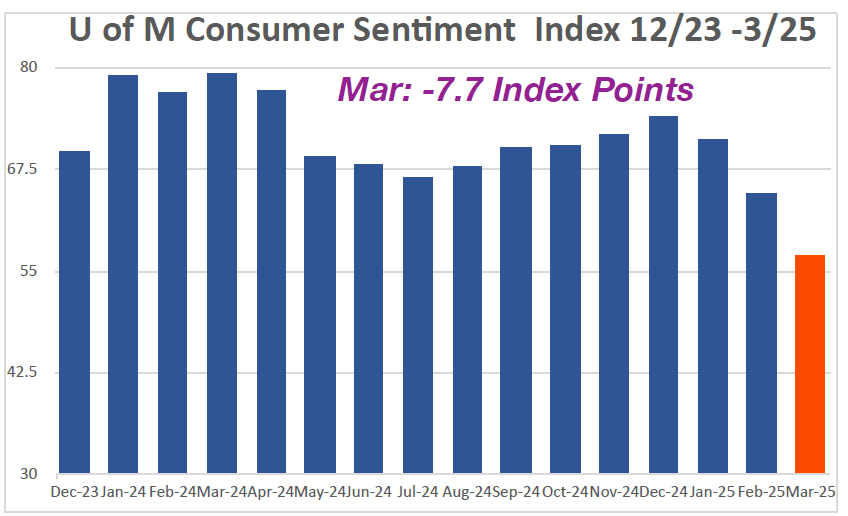
US Consumer Sentiment, as measured by the University of Michigan Index, fell for the third straight month, plummeting 12% from February - and is now down > 23% since last December. March’s decline reflects a clear consensus: Republicans joined Independents and Democrats in worsening expectations for personal finances, business conditions, unemployment and inflation. Notably, 2/3 of respondents expect unemployment to rise, the highest reading since 2009 and a key vulnerability, as strong labor markets were the primary source of strength supporting consumer spending in recent years.

Index and Sector Analysis:
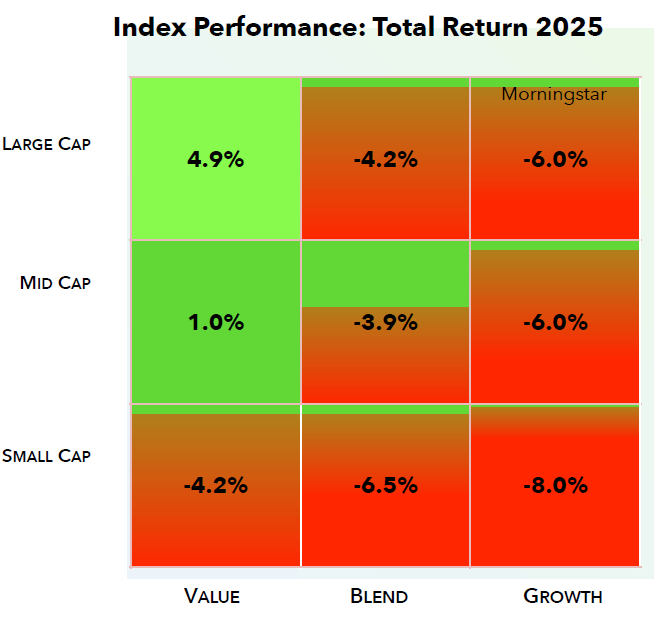
Indices: Since the last newsletter, all index quadrants are down, following the S&P. Value quadrants performed relatively better, down ~3.0%, with Large-cap Value only down 1.1%. On the other side, Growth quadrants fell 8.5% on average, led by the “Magnificent 7” (Apple, Microsoft, Nvidia, Amazon, Meta, Alphabet and Tesla), hit by interest rate concerns and inflationary pressures, along with political fallout affecting Tesla. On a YTD basis, with the S&P now negative, only the Large and Mid-Cap Value quadrants remain positive. Flight to quality has led Small-cap Growth down the most at -8.0%.
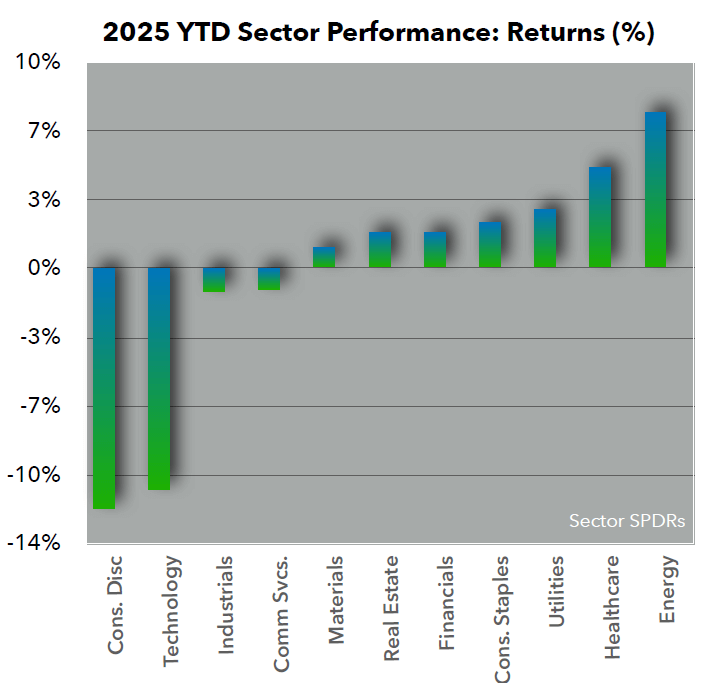
Sectors: Since the last newsletter, all sectors declined with the exception of Energy. Technology was by far the big laggard, falling 12.2% due to Tesla and the other names mentioned above. Consumer Discretionary and Communications Services were down 9.5% and 7.5% respectively. The only sector that rose was Energy, up 1.7% based on increases in crude oil prices driven by a combination of geopolitical tensions, supply disruptions, and demand. Currently only four of the 11 S&P Sectors are down YTD, but due to the heavy weighing of Technology, the entire index is down since the beginning of the year.


Fixed Income Market Update – March 2025
Since the last newsletter, demand for US government debt has risen, causing Treasury yields to decline: the 2-year yield dropped from 4.202% to 3.912%, and the 10-year yield declined (more modestly) from 4.43% to 4.25%, indicating a measured adjustment in long-term growth expectations. One catalyst has been uncertainty surrounding trade tariffs and fiscal policy debates, driving a "flight to quality," as investors sought the safety of Treasuries and other haven assets, contributing to declining yields. Other reasons include shifting market expectations for interest rates, signaling increased confidence in potential Federal Reserve rate cuts or easing inflationary pressures.
The Federal Reserve maintained a cautious stance, closely monitoring the economic impact of tariff policies. Officials voiced concerns that tariffs could fuel inflation and slow economic growth, complicating the Fed’s dual mandate of managing inflation and unemployment. Market participants responded by adjusting their expectations, with futures markets pricing in at least three rate cuts in the latter half of 2025. This reflected mounting concerns over economic momentum and the need for policy accommodation.
Overall, fixed income markets in March were marked by heightened volatility, and we are closely watching Federal Reserve signals and economic data to navigate the evolving landscape.
Corporate Earnings
Overall, 107 S&P 500 companies have issued quarterly EPS guidance for the first quarter. Of these companies, 68 have issued negative EPS guidance and 39 have issued positive EPS guidance. Firms with negative EPS guidance is above both the 5-year average (57) and above the 10-year average (62). Similarly, companies issuing positive EPS guidance is below the 5-year average. The higher incidence of negative EPS guidance is being driven by multiple macroeconomic and sector-specific factors. Persistent inflation and elevated interest rates continue to pressure corporate margins, increasing borrowing costs and reducing consumer and business spending. Additionally, ongoing trade uncertainties and tariffs are impacting supply chains and cost structures, particularly for industries reliant on global sourcing and exports. These factors have led many companies to adopt a more cautious earnings outlook for the first quarter of 2025.
At the sector level, the Information Technology sector has seen the highest number of companies issuing negative EPS guidance. This can be attributed to several challenges, including slower enterprise IT spending, weakening demand for consumer electronics, and supply chain disruptions affecting semiconductor and hardware manufacturers. Additionally, the strong U.S. dollar may be weighing on multinational tech firms, reducing the value of overseas earnings when converted back to dollars. The sector is also facing increased competition and margin pressures as businesses navigate evolving AI investments and cloud computing costs.
Beyond technology, other sectors such as Consumer Discretionary and Industrials may also be contributing to the overall rise in negative guidance. Higher input costs, shifting consumer behavior, and geopolitical tensions could be creating additional headwinds. As earnings season unfolds, we will closely monitor whether these challenges persist or if companies can adapt strategies to mitigate these pressures.


