Market Overview
This month's models have been posted. There were NO CHANGES in the models.
Whipsaw on Wall Street
What a difference a few weeks make.

A Post-Impressionist view of U.S. equity markets in 2018. The third quarter is represented by Vincent van Gogh’s Sunflowers (1889). Credit: The Van Gogh Museum, Amsterdam
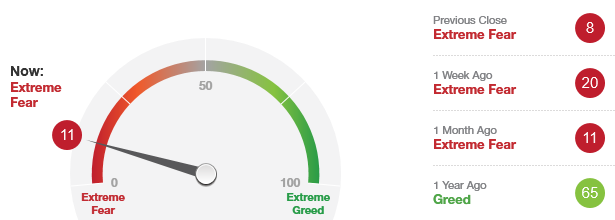
Over the summer, U.S. stock indexes shot up like sunflowers (sorry – we just saw the new Van Gogh biopic). By the second week of October, though, the aggregate market value of leading American industrial companies was in virtual freefall until it recovered in the last days of that month. Share prices continued in a positive direction well into November but then changed direction again and, by Thanksgiving weekend, the stock market had given back every iota of its 2018 growth.
Good news on the global trade front followed, as well as strong holiday-season retail signals, causing stock indexes to rebound every bit as sharply as they fell. When work on this article began first thing in the morning on December 4, share prices were continuing to climb but, by the time we finished that afternoon, the Dow Jones Industrial Average dropped 800 points.
This has been an intensely volatile season so far, and there’s no indication that’s coming to an end anytime soon.

A Post-Impressionist view of U.S. equity markets in 2018. The fourth quarter to date by Van Gogh's Wheatfield With Crows (1890). Credit: The Van Gogh Museum, Amsterdam
Drivers and levers
Wall Street’s recent gyrations tended to be news-driven. That is to say, they have generally been linked to trade news. Sharp daily downturns often relate to recent rhetoric out of Washington or Beijing about the on-again-off-again trade war that makes the Katy Perry-Orlando Bloom relationship look like the model of consistency. Sharp upticks occurred when more moderating views were captured along Microphone Alley. Witness the December 3 spike following the announced 90-day ceasefire between Presidents Trump and Xi, then the cratering a day later following Trump’s remarks that appeared to back off the previous day’s conciliatory tone.
The case could be made that the stock market has been on a hair trigger. Jawboning isn’t action and, besides, exports account for only about 11% of the U.S. economy. That’s not nothing, but a trial balloon about trade policy is also unlikely to drastically change the true value of an American industrial company at 4 p.m. from what it was at 9:30 a.m.
Of course, exports are only part of the equation. Although nobody in the Trump Administration or General Motors’ investor relations department is saying it, it’s absolutely true that GM’s 14,000 recently announced layoffs have something to do with the added cost of paying tariffs on steel and aluminum imports from China. It’s not the primary factor, but it is a factor. And it must be mentioned that GM shares soared November 23 on the news that it would shutter five factories, pulling the Dow and S&P higher on that day.
A much more important driver of valuations is interest rates. By the time you read this, the Federal Reserve Board of Governors may have announced its fourth target interest rate hike of 2018. Rising yields tend to steal the wind out of equities’ sails, so these announcements are rarely reflected positively in the indexes. Conversely, when Fed Chairman Jay Powell makes prepared remarks that he and his colleagues don’t see the need at the moment to raise rates as frequently in 2019, as he did November 28, the stock market rallies.
Interest rates had a hand in December 4’s selloff. Although the U.S. president’s “tariff man” tweet garnered the headlines and attention from late-night comics, the more substantive and sobering cause for concern was the yield-curve inversion. As we’ve discussed in this space, an inversion occurs when it’s a better business decision to rollover short-term notes rather than invest in long-term bonds. Zacks and others report that two- and three-year Treasury notes now offer higher yields than five-year notes. This might not be the death-knell for the record-shattering economic expansion, but it is certainly a warning sign. If these notes start offering higher yields than the 10-year bill or 30-year bond, that would be a clearer signal.
Looking forward
There are a number of strategies a savvy investor can take to mitigate exposure to stock market volatility. Panic isn’t one of them.
There’s no indication of serious problems in the U.S. economy right now. Corporate earnings continue to grow although they could be cresting. Time will tell. Inflation remains under control, but tariffs and rising wages as a result of record-low unemployment could change that. Again, time will tell. Ultimately, gross domestic product is expanding, and we must remember that recessions are linked with bear markets. The technical definition of recession is two successive quarters of shrinking GDP. That does not seem likely for Q4, nor Q1 or Q2 of 2019. It’s a tougher read any further out than that because of the changing landscape in trade and interest rates.
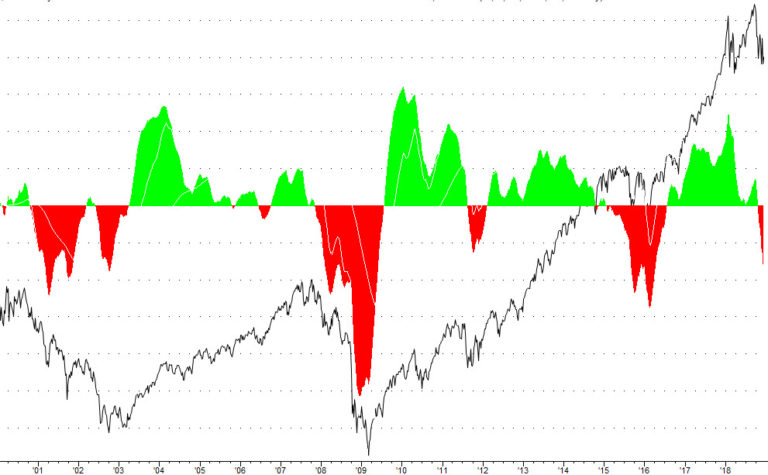
Markets find direction when there’s a consensus view of where the economy is going, but neither the bears nor the bulls can claim victory today. Recent market trading sessions clearly show that some days there are more buyers and others there are more sellers. Also worth mentioning is the Fed’s current course of “Reverse QE,” as the Fed is removing liquidity from the marketplace on a monthly basis. These things contribute to day-to-day volatility, and this variability of today’s prices and the ambiguity of tomorrow’s prices and your stomach for that ambiguity is the true meaning of your “risk tolerance.” So, you have to ask yourself now and next year and the year after that, “how much of this risk can I stand in order to achieve my investment goals?”
The accompanying Captain’s Table column provides some further insights about how to allocate your assets as it relates to your feelings and appetite for risk. Of course, there’s no substitute for getting expert advice from an accredited financial professional who’s invested through a correction or two.
 We are saddened by the passing, after a long and momentous life, of the 41st President of the United States.


