Market Overview
This month's charts have been posted. There are CHANGES in ALL the models (highlighted in yellow).
Inflation. The facts.
We’re hearing a lot about inflation lately, and some of it is true. Prices for a lot of goods are spiking. The government “created” $11.8 trillion since the pandemic began, and printing that many dollars – as any freshman economics text will tell you – is bound to have the effect of reducing the value of every single dollar.
But a catastrophic level of inflation hasn’t happened, or at least it’s not happening yet. There’s been some unwelcome news about consumer prices over the past couple months – but is it just a short-term peak or is it a sour taste of things to come? Let’s take a clear-eyed look at where the disconnects lie, and what we can expect going forward.
What does $13 trillion buy?
What would you do with $11.8 trillion? Some of us might buy up every last share of Apple, Microsoft, Alphabet, Amazon, Tesla, Meta, Berkshire Hathaway and JPMorgan Chase, then take each of our new employees out for a steak dinner.
But is there even that much money in America? Yes, as it turns out. If you add up all the bills and change in everyone’s wallets plus their bank deposits, you come to about $20.1 trillion. That’s the so-called M1 money supply. By convention, economists add in money-market funds and other near-cash equivalents. By that measure, what is known as M2, there is $21.2 trillion floating around. The Federal Reserve has, apart from that, a net $4.1 trillion on its balance sheet. It’s sobering to consider that almost half of all the dollars in the world emanated from the literal or figurative printing press within the past two years.
While some note that inflation has tripled since before the pandemic, let’s remember that we’re scaling off a very low benchmark. If there’s really a flood of money eroding the dollar’s value, why is inflation only 7% and not 50%? That said, 7% inflation is high enough to pique the attention of anyone with an interest in the economy.
We’ll start with the composition of that $11.8 trillion. The price tag directly attributable to Covid-19 and the economic response was $5.2 trillion, and that sounds like a lot until you compare it to what we spent on World War Two -- $4.7 trillion – plus another $114 billion for the postwar Marshall Plan – adjusted for inflation.

“But was it worth $4.7 trillion?” Credit: Alfred Eisenstaedt, Life Magazine
Fast money? Not really
Another chunk of 2020-21’s new money stems from the Fed’s policy of quantitative easing – that is, buying debt in order to keep interest rates low so that American businesses can lead us in growing out of this hole we’ve dug. Then there’s the $1.2 trillion that’s been budgeted – but still almost entirely unspent – on hard infrastructure projects. All these measures received significant bipartisan support.
Not counted is the Build Back Better plan, which is neither bipartisan nor enacted law. At an estimated $1.9 trillion, it would not be the biggest component of the two-year splurge and is unlikely to get to the Senate floor before 2022 – if it gets there at all. If we go into an inflationary spiral, increased spending on soft infrastructure won’t help, but it’s not likely to be the factor that pushed us over the edge.

M2 money supply. Source: Federal Reserve Bank of St. Louis
If the popular wisdom is that hyperinflation is coming because of all the money being created, though, what’s been saving us so far? And how long can it continue saving us?
The answer is what economists call the velocity of money. It’s the frequency with which one dollar is used to purchase goods and services in one year. If the velocity of M2 is increasing, then more transactions are occurring between individuals in an economy. If it’s decreasing, then Americans are consuming less. Increasing velocity is seen as inflationary, according to the Corporate Finance Institute, and presumably decreasing velocity would be disinflationary. Here’s what it looks like now:

Velocity of M2. Source: Federal Reserve Bank of St. Louis
Velocity has been trending down throughout the entire economic expansion of the 2010s – since 1997, to be thorough – and that’s been a big factor in why the budget busting of the past three presidential administrations hasn’t had the inflationary effect which so many in politics and the media have predicted. Then, during the pandemic, velocity really fell off a cliff and has been holding steady at a low point ever since. While this hasn’t been enough to completely offset inflation, the decline in velocity goes far in explaining why consumer prices aren’t keeping pace with the increase of money supply.
Velocity, then, is what we need to pay closer attention to – not to the exclusion of money supply, but in conjunction with it. Unless and until M2 velocity rises precipitously, we may not have to worry about 1970s-style inflation.
Inflation today
We do need to be concerned about 2020s-style inflation, though, so let’s define our terms. Consumer price increases can be caused by tight supplies or overwhelming demand, as we discussed here in March. The usual culprits for “cost-push” inflation – a devaluation of the currency and increased taxes – are not in evidence, but the wholly unprecedented glitching of the global supply chain has had the same effect. This is also where expectations of future inflation could become self-fulfilling prophecies as firms raise their own prices in anticipation of their suppliers raising theirs.
Currently, households surveyed by the Federal Reserve Bank of New York expect prices to rise at a 5.7% rate over the coming year and a 4.2% annualized rate over three years. While that’s twice as high as the Fed would like to see, it’s nowhere near the 14.6% experienced in May 1980, the highest in the U.S. since 1948, when tracking started. But what’s telling is that people expect inflation to be spiky in the short term but return to equilibrium over time, which reflects the widespread view that the supply-chain issues are substantial but will be of limited duration.
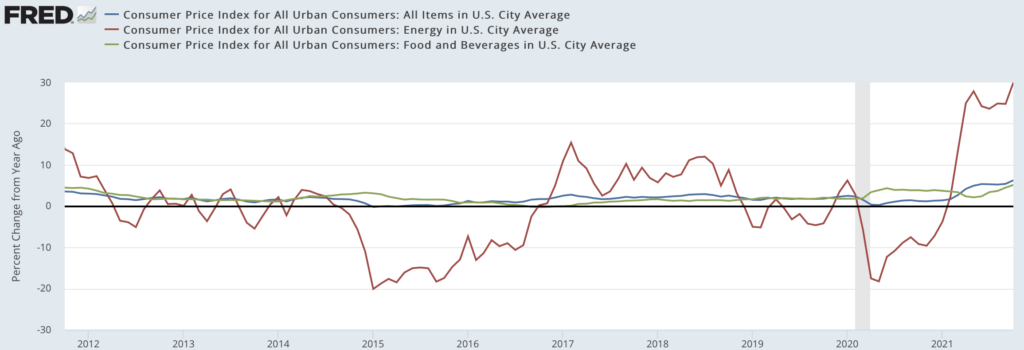
This also dovetails with the nature of the goods and services that are most impacted by the current bout of inflation. When measuring inflation, authorities are keen to distinguish energy prices – which have always been volatile – and food prices – which have frequently been volatile through history – from so-called “core” consumer prices. While food prices might have surged at the beginning of the pandemic, they quickly fell back in line. Energy, meantime, seems to be spurring on whatever inflationary cycle is out there. But even that might have run its course. According to the AAA, gas prices – which had been rising all year – dipped 4 cents per gallon in the first week of December to $3.35 on average.

Food, energy and core inflation. Source: U.S. Bureau of Labor Statistics
Cost-push inflation isn’t the only threat out there. “Demand-pull” inflation could also play a part in any erosion of buying power. The big drivers here are interest rates (already low), monetary supply (which we just discussed) and higher wages. It’s this last item that’s worth examining because we’ve heard so much about how a labor shortage has caused entry-level wages to soar. While those anecdotes are undoubtedly true, they don’t seem to have much of a long-term effect on the broader pay scale.

Year-over-year change in annual hourly earnings of all private-sector employees. Source: U.S. Bureau of Labor Statistics
While there was one month early in the pandemic where hourly wages jumped 8.2% compared with the year-earlier period, that was not sustained. The legacy of the period seems to be that people who had gotten 2% to 3% raises historically are now getting 4% to 5% raises. That’s not causing inflation; it’s barely keeping up with it.
There is one remaining element that keeps people up at night: real estate. Any homebuyer or, for that matter, home seller will tell you: Prices are going up. And if prices for families’ biggest-ticket item are getting gouged, then that’s bound to put upward pressure on all prices, right?
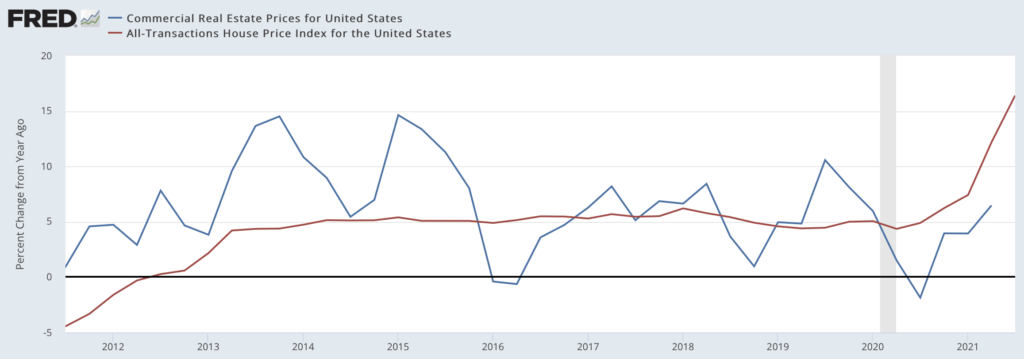
Yes, if that was the whole story rather than half of it. Residential real estate saw a dizzying 16.4% jump between September 2020 and September 2021, after bopping along at a 5% annualized growth rate for years. Meanwhile commercial real estate, which had its heyday between 2013 and 2015, tanked during the pandemic. It has come back since then but is only growing at – predictably – the rate of inflation.

Year-over-year changes in residential and commercial real estate prices. Sources: U.S. Federal Housing Finance Agency, International Monetary Fund
What the above graph shows is a rebalancing of real estate expenditure, not a sudden surge in it. Instead of spending on the offices and malls we found we can live without, developers and realty agents are turning their attention to America’s housing stock, which has long been overlooked. According to CNBC, we could fill 5 million new housing units overnight if we could build them that fast.
The smart money
As much as many people like to complain about the relatively tame inflation we’re currently encountering, and as much as they enjoy making doom-and-gloom prediction about the hyperinflation they imagine is coming, those who make a living predicting price movements are having none of it.
While market experts can be wrong – sometimes spectacularly so – they’re paid big bucks to be right far more often, so they have access to better data and better models than we do. Let’s pay attention, then, to what the all-star pros are doing rather than what the junior-varsity pundits are saying.
We’ll start with the price of gold. It’s an inflation hedge and, in fact, there aren’t a whole lot of other reasons to buy it. The first trading day after the shutdown, gold took a nosedive because the whole world’s economic output stopped and that left no room for inflation. Five months into the shutdown, though, it skyrocketed 40%. Since that August 2020 peak, it has dipped more than 12%. Even so, gold is still expensive by historical standards, thus there is some concern about inflation, even if it’s not as pronounced as it was at the peak of the pandemic. Incidentally, gold prices have been rising slowly and steadily since 2018, two years before Washington’s spending spree.
Next, let’s look at foreign exchange. If the U.S. is experiencing inflation out of line with the rest of the world, then the U.S. dollar should be losing value against other reserve currencies. And yet the euro, pound and yen have only moved a couple pennies off their dollar values from early March 2020. That said, American inflation is currently more pronounced than that in other leading economies. Our nearly 7% November reading exceeds Europe’s and Britain’s – both around 5%.
How about interest rates? These go up when monetary authorities are trying to curb inflation and down when they’re trying to encourage the private sector to create more jobs. During the Great Recession, the Fed Funds rate – what money-center banks charge each other overnight – was effectively 0%. As inflation began to be perceived as a risk in 2018, the Fed Funds rate stair-stepped up to around 2.5% before reversing course in 2019. The pandemic saw it drop suddenly from 1.5% to near-zero. It’s still there. If the Fed board – most of whom were appointed by President Trump – thought that inflation was a major threat to the U.S. economy, they’d be raising interest rates like a drawbridge, especially considering that America already has more open jobs than it can readily fill. You can look at Treasury yields, prime rates, mortgage rates or any other metric and you’ll see the same thing: Interest rates are rising, but slowly, and only because there’s little room to drop.
It’s complicated
Are we cherry-picking our data points to support our thesis? Maybe. From where we sit, it looks like inflation will be higher in the near future than it has been in the near past but – housing and energy prices aside – we’re not seeing economic Armageddon. Of course, everyone has to live somewhere and they probably have to heat that abode, so there will be ripples from housing and energy costs. Even so, we don’t expect to be paying $15 for a Big Mac anytime soon.
Even if inflation is not a catastrophe, though, it’s still a problem. It will nibble at not only your paycheck but also at the returns on your investment portfolio. So, this could be a good time to talk to your financial advisor about how to protect your nest egg from inflation – whether it turns out to be a little or a lot – for a couple reasons.
First, ‘tis the season for year-end tax planning.
Second, if you wait too long, the price for financial advice might go up.


