Market Overview
Since the last newsletter, all major US equity indices rose, with the S&P 500 rising 6.38%, the DJII up 5.33%, and the NASDAQ up 8.20%. Model portfolios remain well balanced, therefore there are NO CHANGES.
U.S. Markets Rebound
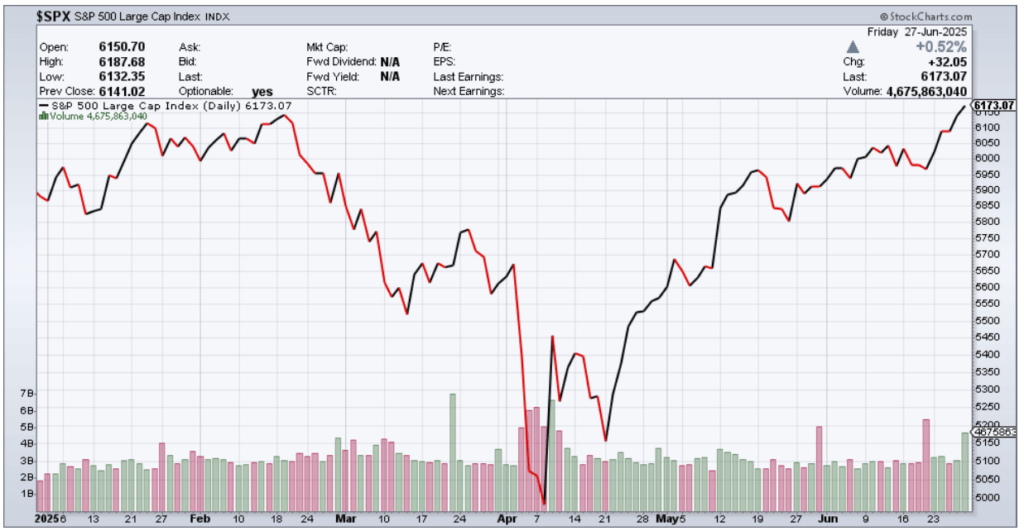
U.S. equities continued their rebound, reaching a new all-time record high last Friday of 6,173. This marked a remarkable recovery since the S&P 500 flirted with bear-market territory in early April. The NASDAQ Composite also hit a record high on the same day. Reasons behind the growth include optimism about interest rates, the recent ceasefire between Iran and Israel, continued enthusiasm for AI, and a weakening in the US dollar.
Interest rates
While the Federal Reserve has not cut interest rates so far this year, growing investor confidence in the likelihood of two or more rate cuts by year-end has supported equity markets. This optimism has been reinforced by dovish commentary from Fed officials, signaling a potentially more accommodative policy stance ahead.
Geopolitical and Trade De-tensioning
The recent easing of Middle East tensions, specifically the cease-fire between Israel and Iran, has boosted investor sentiment by reducing fears of a disruption to global oil supply and a potential surge in energy prices. Similarly, the broader de-escalation of trade tensions, particularly with China, has supported market confidence. However, President Trump’s announcement of new tariffs on Canada imports late in Friday’s session came too late to be fully priced in. In absence of offsetting positive developments, we expect markets may be volatile in the near term, depending on how the final scope of the tariffs unfolds.
Artificial Intelligence
The broader narrative of AI’s booming productivity, revenue and margins across various sectors remains a powerful market tailwind, especially for large tech companies that can take advantage.
What We’re Watching
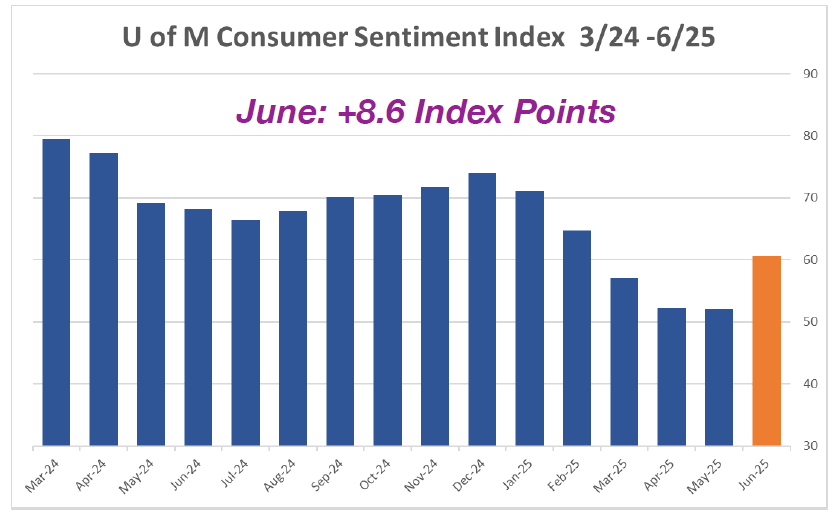
Index of Consumer Sentiment
US Consumer Sentiment, as measured by the University of Michigan Index, jumped up 16% (+8.6 index points) in its first increase in six months, but remains well below its recent high of December 2024. The improvement was broad based, across numerous facets of the economy, including a material drop in inflation expectations along with lower fears about tariff impacts. Consumers do not appear to be connecting the domestic economy with Middle East developments yet.
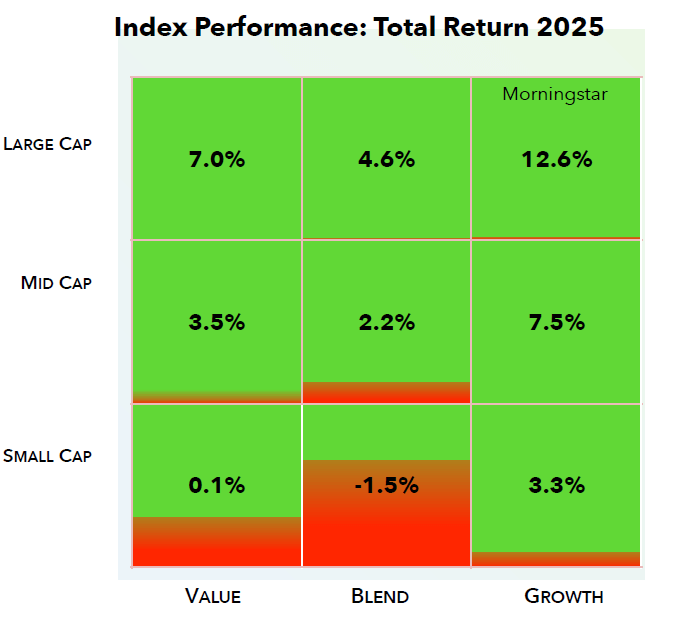
Index and Sector Analysis:
Indices: All index quadrants rose since the last newsletter, relatively equally. Value quadrants were slightly lower, on average, at +4.7%, while growth quadrants showed an average gain of 6.5%. The leading quadrant was Large-cap Growth, up 7.6%, based on the big technology names benefitting from continued investor demand for AI.
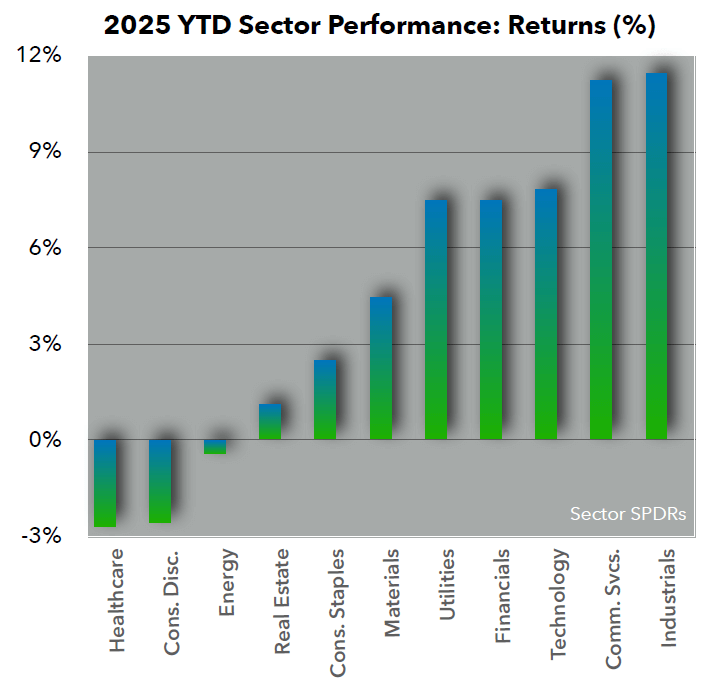
Sectors: With the S&P 500 index gaining 5.0% since the last newsletter, all eleven S&P Sectors rose with the lone exception of Consumer Staples. On average, cyclical sectors outperformed this month, led by Technology (+10.3%), Communications Services (+7.7%, partially due to META. rising from optimism about its AI infrastructure and potential reductions in regulatory risks), and Industrials (+4.5% as Caterpillar (CAT) and Delta Airlines (DAL) announced dividend increases). Laggards were defensive sectors such as Consumer Staples (-1.3%, from a general rotation from more stable but lower-growth defensive sectors into higher growth areas) and Utilities (+0.4%).
Fixed Income Market Update
Treasury yields declined across the curve from late May through June, reflecting softer economic data, a more cautious Fed tone, and revived investor appetite for bonds. The 2-year yield fell from 4.00% to 3.75%, while the 10-year yield declined from 4.52% to 4.29%. The field curve remains near 50 basis points, a level that has held relatively steady over the past 3 months.
- Softening Economic Data: A weaker-than-expected May jobs report, easing wage growth, and softer June ISM readings signaled a cooling economy. These trends supported the bond rally, particularly in the front-end, as markets increasingly priced in the likelihood of a Fed rate cut before year-end.
- Fed Messaging Turns More Dovish: While the Fed held rates steady at its June meeting, several officials, including Vice Chair Jefferson, acknowledged growing risks of over-tightening. Powell emphasized a data-dependent stance and noted that disinflation was progressing —albeit unevenly— prompting markets to adjust rate cut expectations forward.
- Global Influences Support Rally: Geopolitical uncertainty in Europe and weak industrial data from China supported a modest risk-off sentiment globally, boosting safe-haven demand for U.S. Treasuries. Additionally, falling JGB yields after early speculation of a BOJ rate hike faded removed a headwind from global fixed income markets.
Corporate Earnings
With the start of Q3 approaching, where are stock analysts most optimistic and pessimistic with ratings in the S&P 500? Overall, there are 12,319 ratings on S&P stocks. Of these ratings, 56.4% are Buy ratings, 38.7% are Hold ratings, and 4.9% are Sell ratings. The percentage of Buy ratings is above its 5-year average of 55.1%, and the percentage of both Hold and Sell ratings are below their 5-year averages.
At the sector level, analysts are most optimistic on the Energy (68%), Communication Services (64%), and Information Technology (64%) sectors. On the other hand, analysts are most pessimistic on the Consumer Staples (40%) sector, as this sector has the lowest percentage of Buy ratings. The Consumer Staples (53%) sector also has the highest percentage of Hold ratings, while it (7%) and Utilities (7%) sectors have the highest percentages of Sell ratings.
After falling to 53.6% at the end of October 2024, the percentage of Buy ratings for the S&P 500 has increased to 56.4% today. If 56.4% is the final percentage of Buy ratings for the month of June, it will mark the second-highest (month-end) percentage of Buy ratings for the index since June 2022 (56.9%).
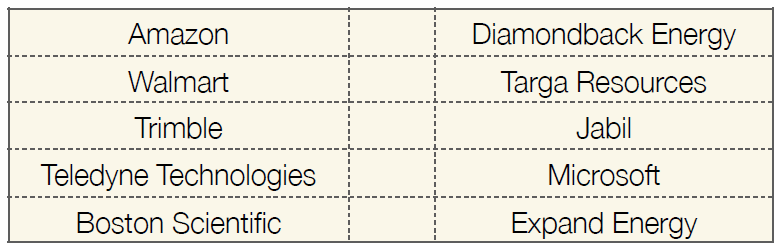
The 10 companies with the highest percentage of Buy ratings are as follows: